
Cytometry workspace
This is the manual. Every tool it describes runs in your browser, free, no account.
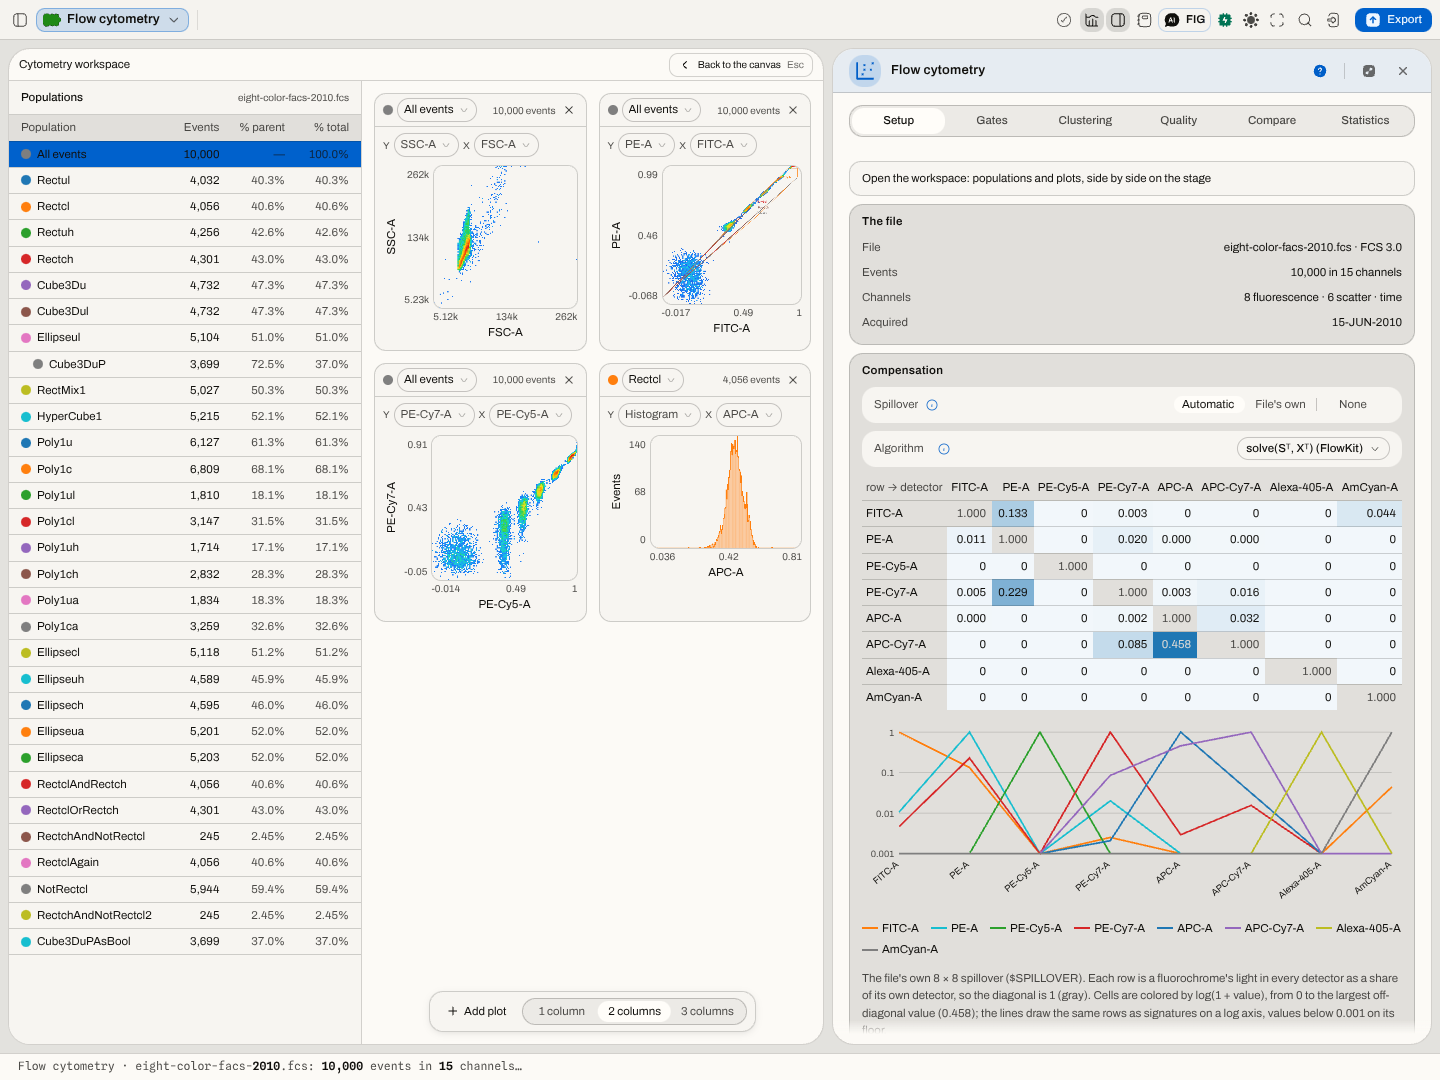
Open the workbenchThe population hierarchy beside a grid of density plots. Each plot chooses its own population and its own two channels, and every gate on that pair is drawn in its population's colour.
What it does
Opening a flow cytometry file opens two panes on the stage. On the left is every population of the gating strategy. On the right are the plots: by default forward against side scatter, then the fluorescence channels in pairs. Add plot adds another, the × on a plot removes it, and 1 / 2 / 3 columns sets how many plots share a row. Setting a plot's Y to Histogram draws its X channel alone, as events per bin, in its population's colour. Clicking a population selects it everywhere: its gate is drawn heavier on every plot, and the panel's statistics follow it.
What this computes
- Events, % of parent and % of total for every population, as the run counts them. % of parent is the population's events over its parent gate's events.
- The density on each plot: every event of the plot's population placed by its two channel values (compensated if compensation is on, fluorescence in the chosen display scale) and counted into a square grid. Colour runs from blue for the sparsest bins through cyan, green and yellow to red for the densest, on log(1 + events per bin), so a rare population stays visible beside a dominant one. The axes span the plotted events' own range.
- The histogram on a plot whose Y is Histogram: the population's events on that one channel, counted into equal bins across their own range, the same binning the density uses.
- Gate outlines: each rectangle, polygon and ellipse defined on exactly that pair of channels, in its population's colour from the list on the left. A gate's edges are straight in the scale it was written in, so a polygon drawn on a Hyperlog axis is curved on a Logicle one, as it should be.
What to look at
- A tight, round population is the picture of a well-compensated, well-stained marker. A population smeared along a diagonal usually means compensation is off or wrong.
- Events piled on an edge reached the end of a channel's range or of the display scale.
- The same gate on two plots shows where a population sits in channels it was not gated on, which is how a gate that also catches debris or doublets gives itself away.
Electropherogram
Every dye channel of a fragment run on one axis in bases, with the size standard's own fragments drawn on it — the picture the peak table is read from.
Circuit netlist
The signal flow of a genetic circuit drawn as the graph it is: which sensor feeds which repressor gate, and where two wires converge.